At a Glance
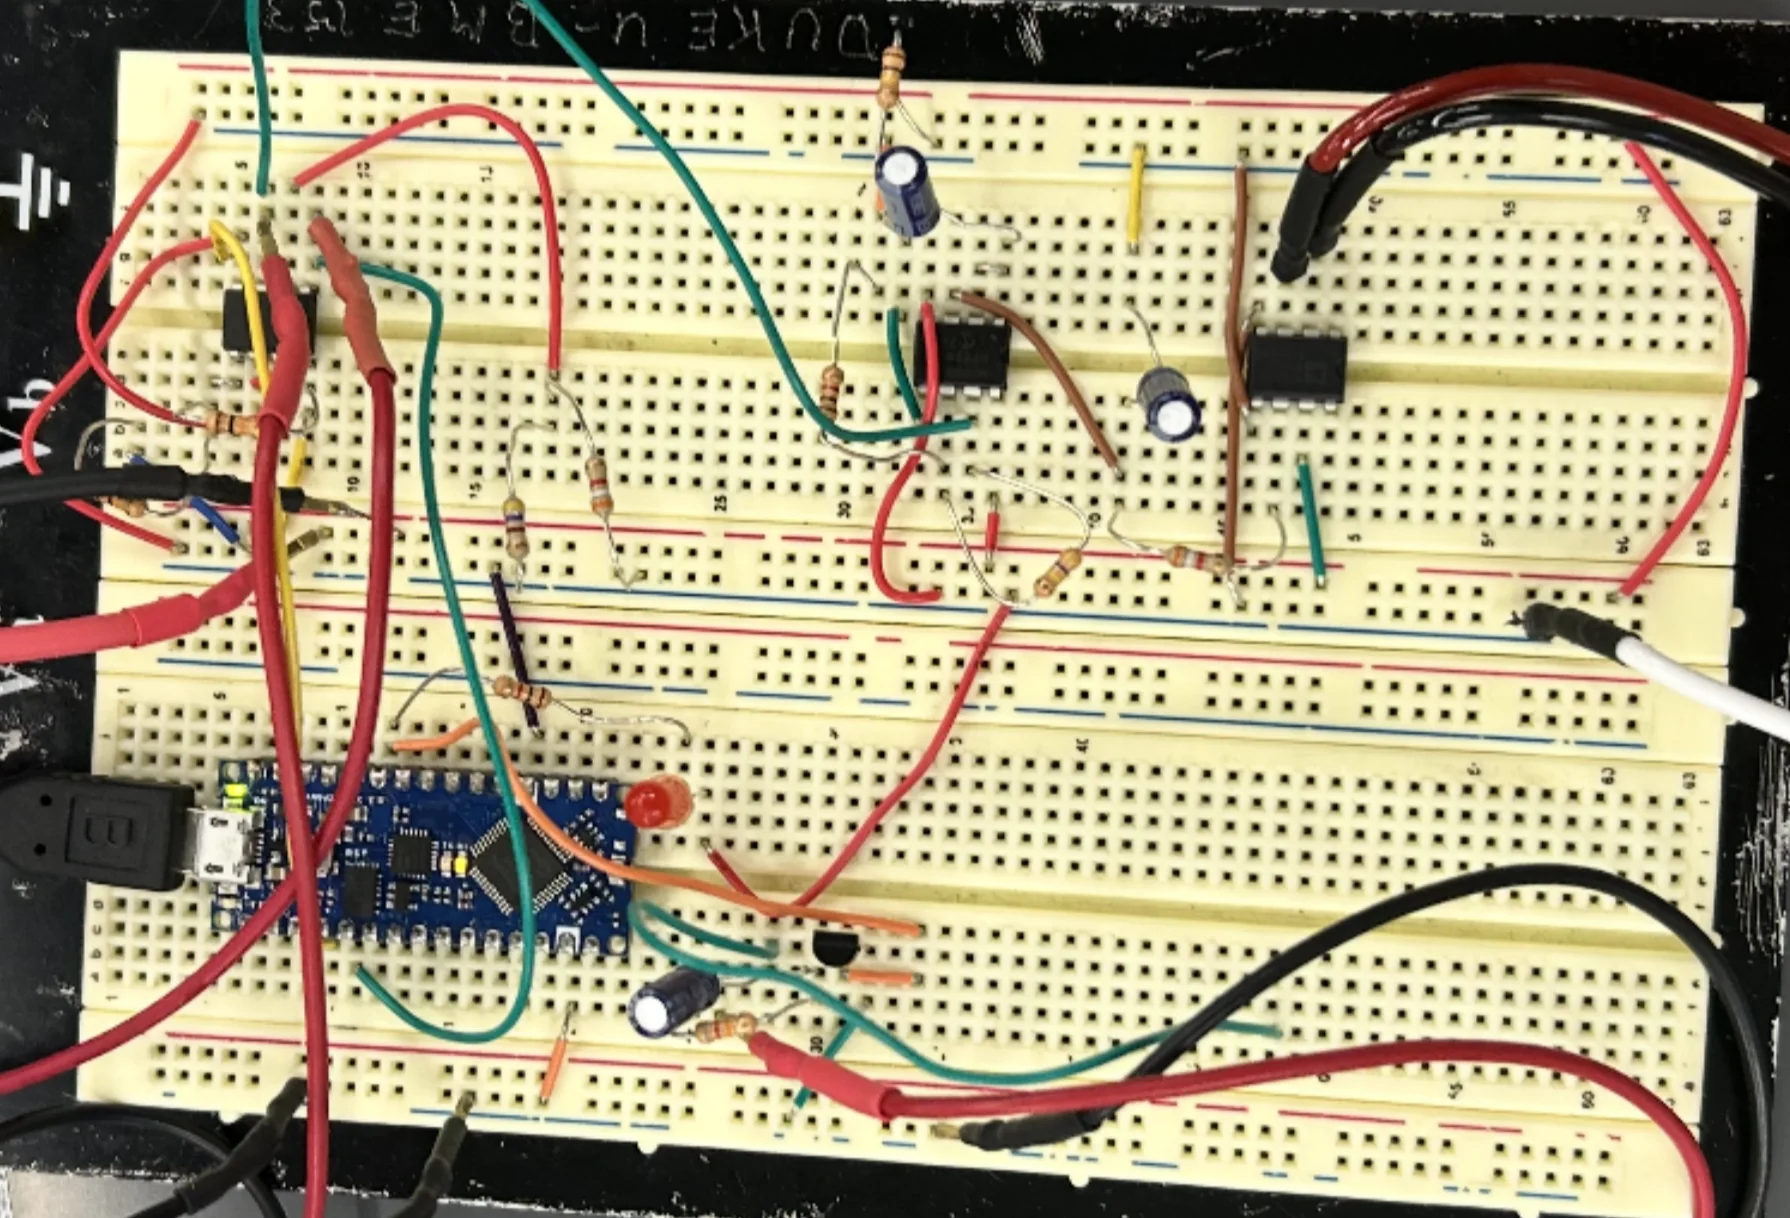
- What: A VVI (demand) pacemaker that senses ventricular activity, stimulates only when too much time has passed since the last beat, and reports every beat and pace wirelessly to a phone over Bluetooth Low Energy.
- My role: Two-person class project. I designed and built the sensing, processing, and stimulation circuits, wrote the pacing firmware, and ran the validation testing.
- Target: Frog cardiac tissue (chronaxie 35 ms, rheobase 260 µA), tested against an ECG simulator.
How It Works
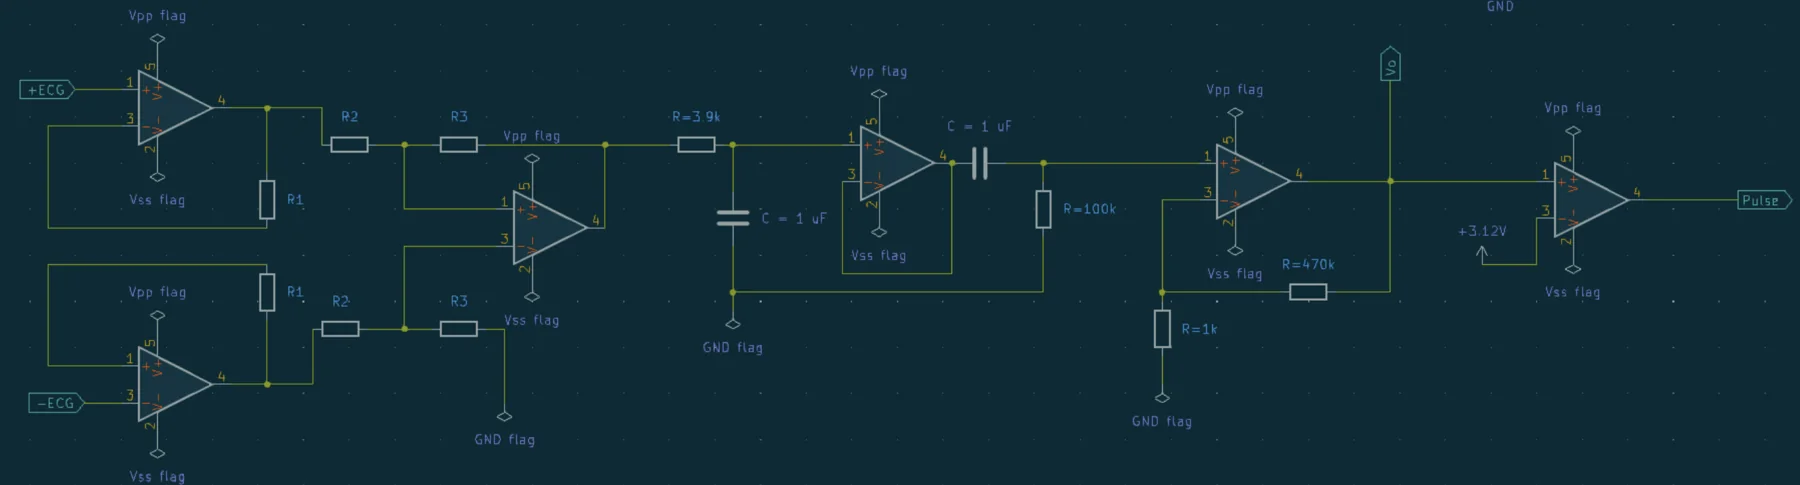
- Sensing: An AD623 instrumentation amplifier makes a differential measurement at unity gain, followed by an RC band-pass (1.59–40.8 Hz designed) to strip baseline drift and 60 Hz noise, then a non-inverting stage with a gain of about 471 to bring the ECG up to a readable level. Everything runs from one supply through a single-split circuit that creates a bipolar rail.
- Processing: A comparator set at 3.12 V turns each R-wave into a clean digital pulse for the microcontroller.
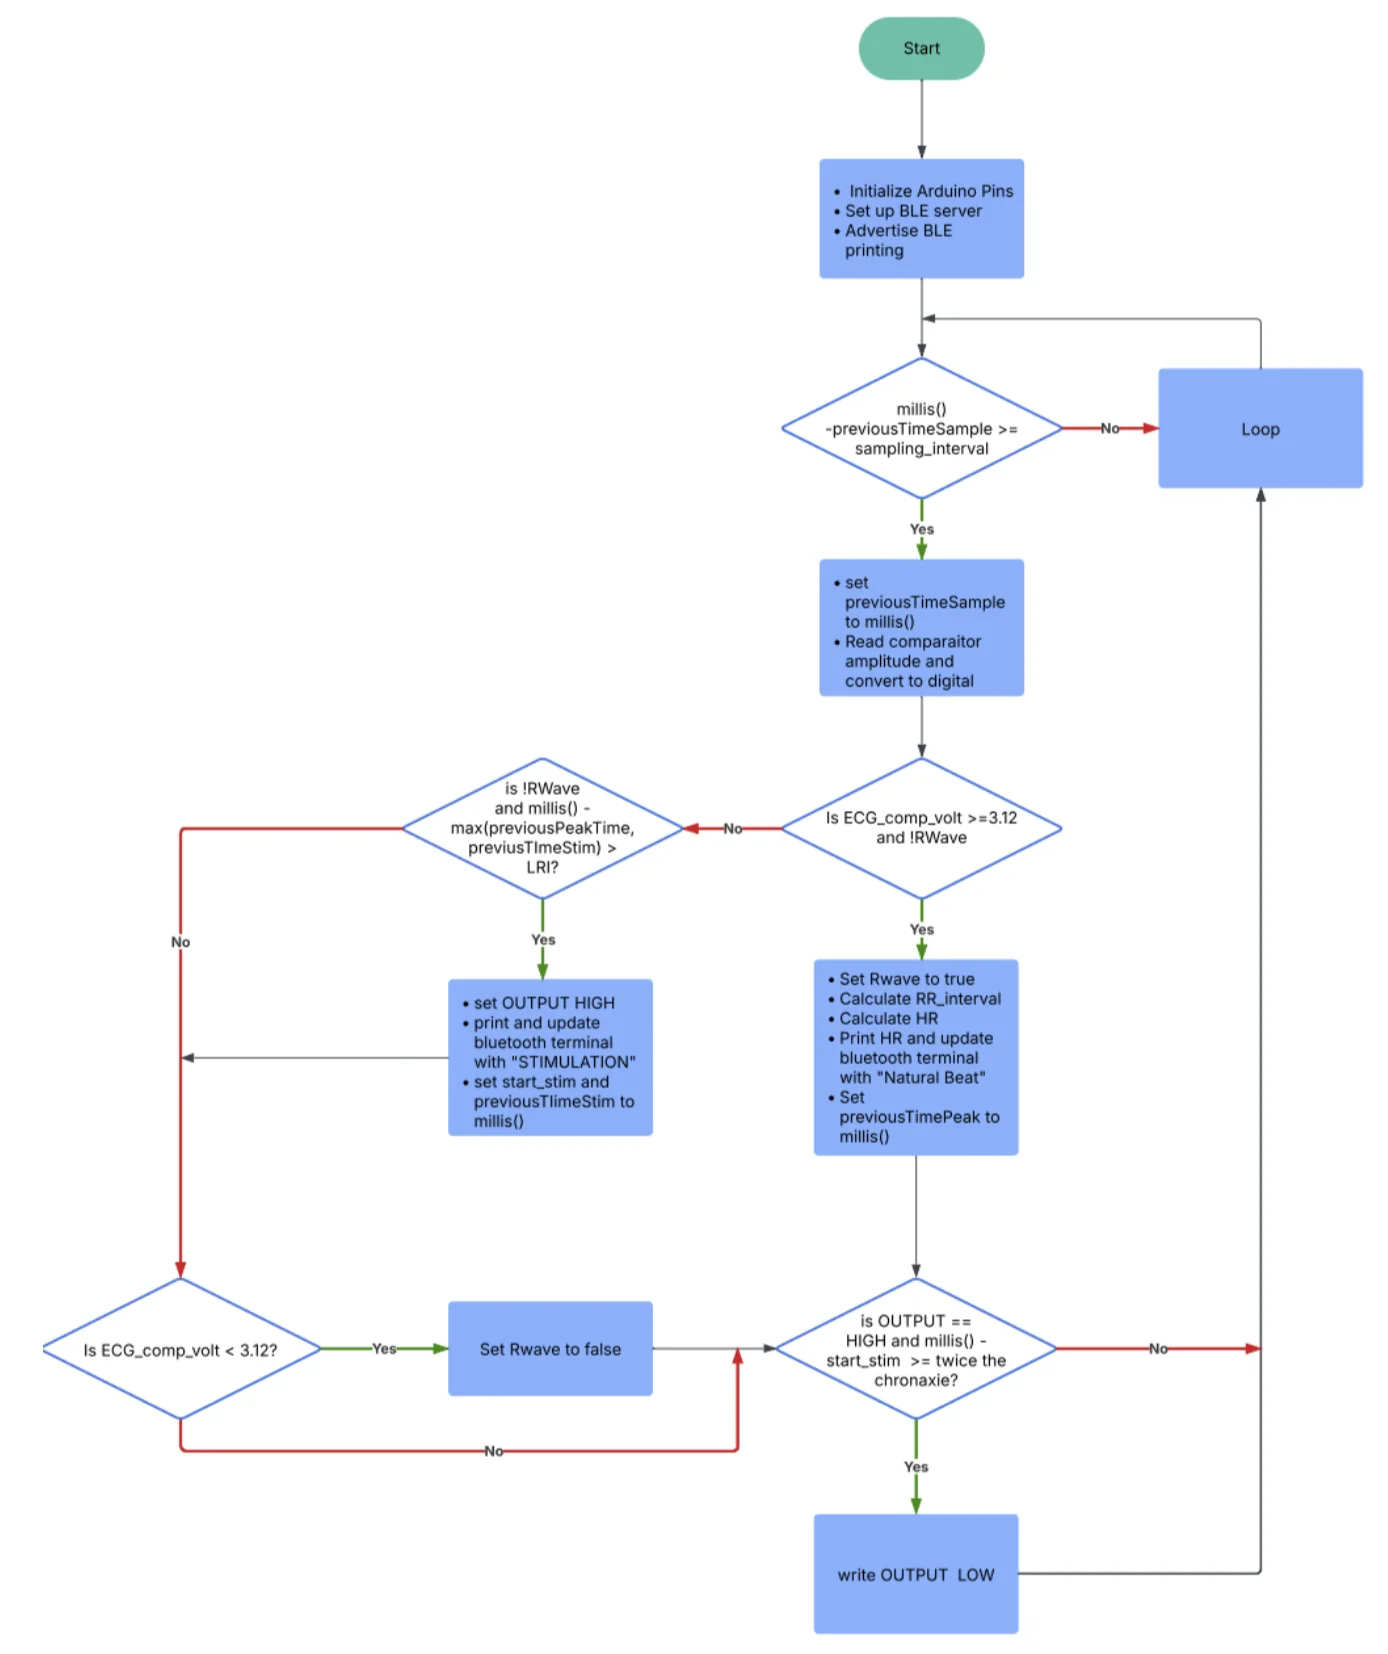
- Pacing firmware: An Arduino Nano ESP32 runs VVI logic in C++. It timestamps each R-wave with
millis(), uses a flag so one R-wave can't be counted twice, and fires a stimulus whenever the time since the last beat or pace exceeds the lower rate interval. - Stimulation: The ESP32 drives a MOSFET that discharges a capacitor through a 1 kΩ load standing in for the heart, for 70 ms (twice the chronaxie).
- Telemetry: The ESP32 notifies an iPhone BLE terminal on every natural beat (with the current heart rate) and every pace.
Early Testing on Real Tissue
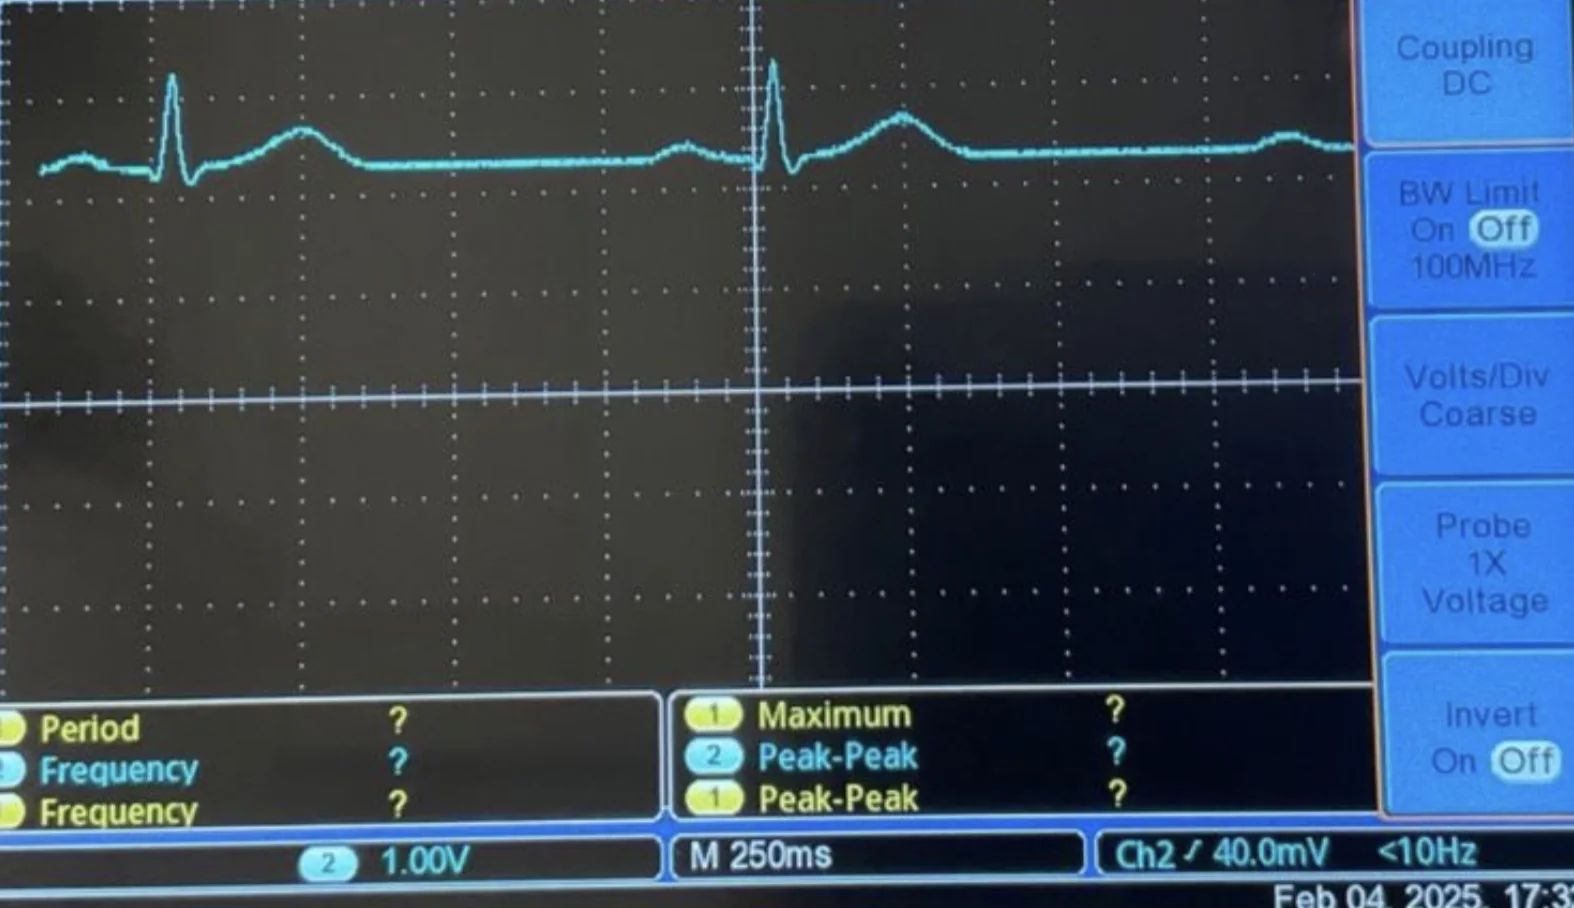
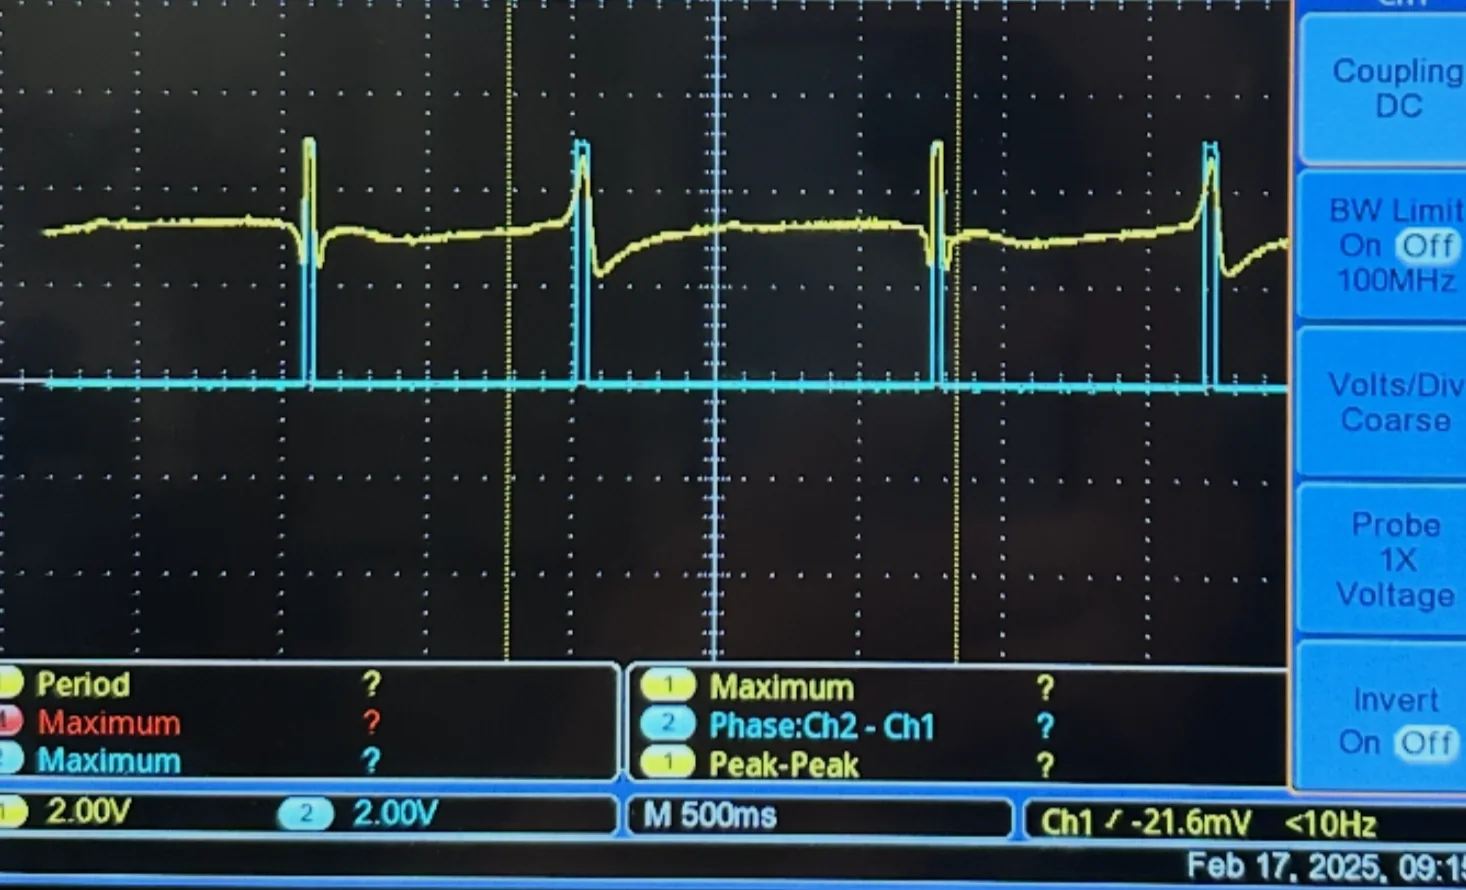
Before the final build, I tested the sensing circuit on a human subject and the pacing circuit, before Bluetooth was added, on a pithed frog heart, where each stimulus produced a captured beat. Frogs weren't available for final testing, so the complete system below was validated against an ECG simulator.
Validation
I tested each block on its own before running the full system, with a written expected value for each.
Signal Chain
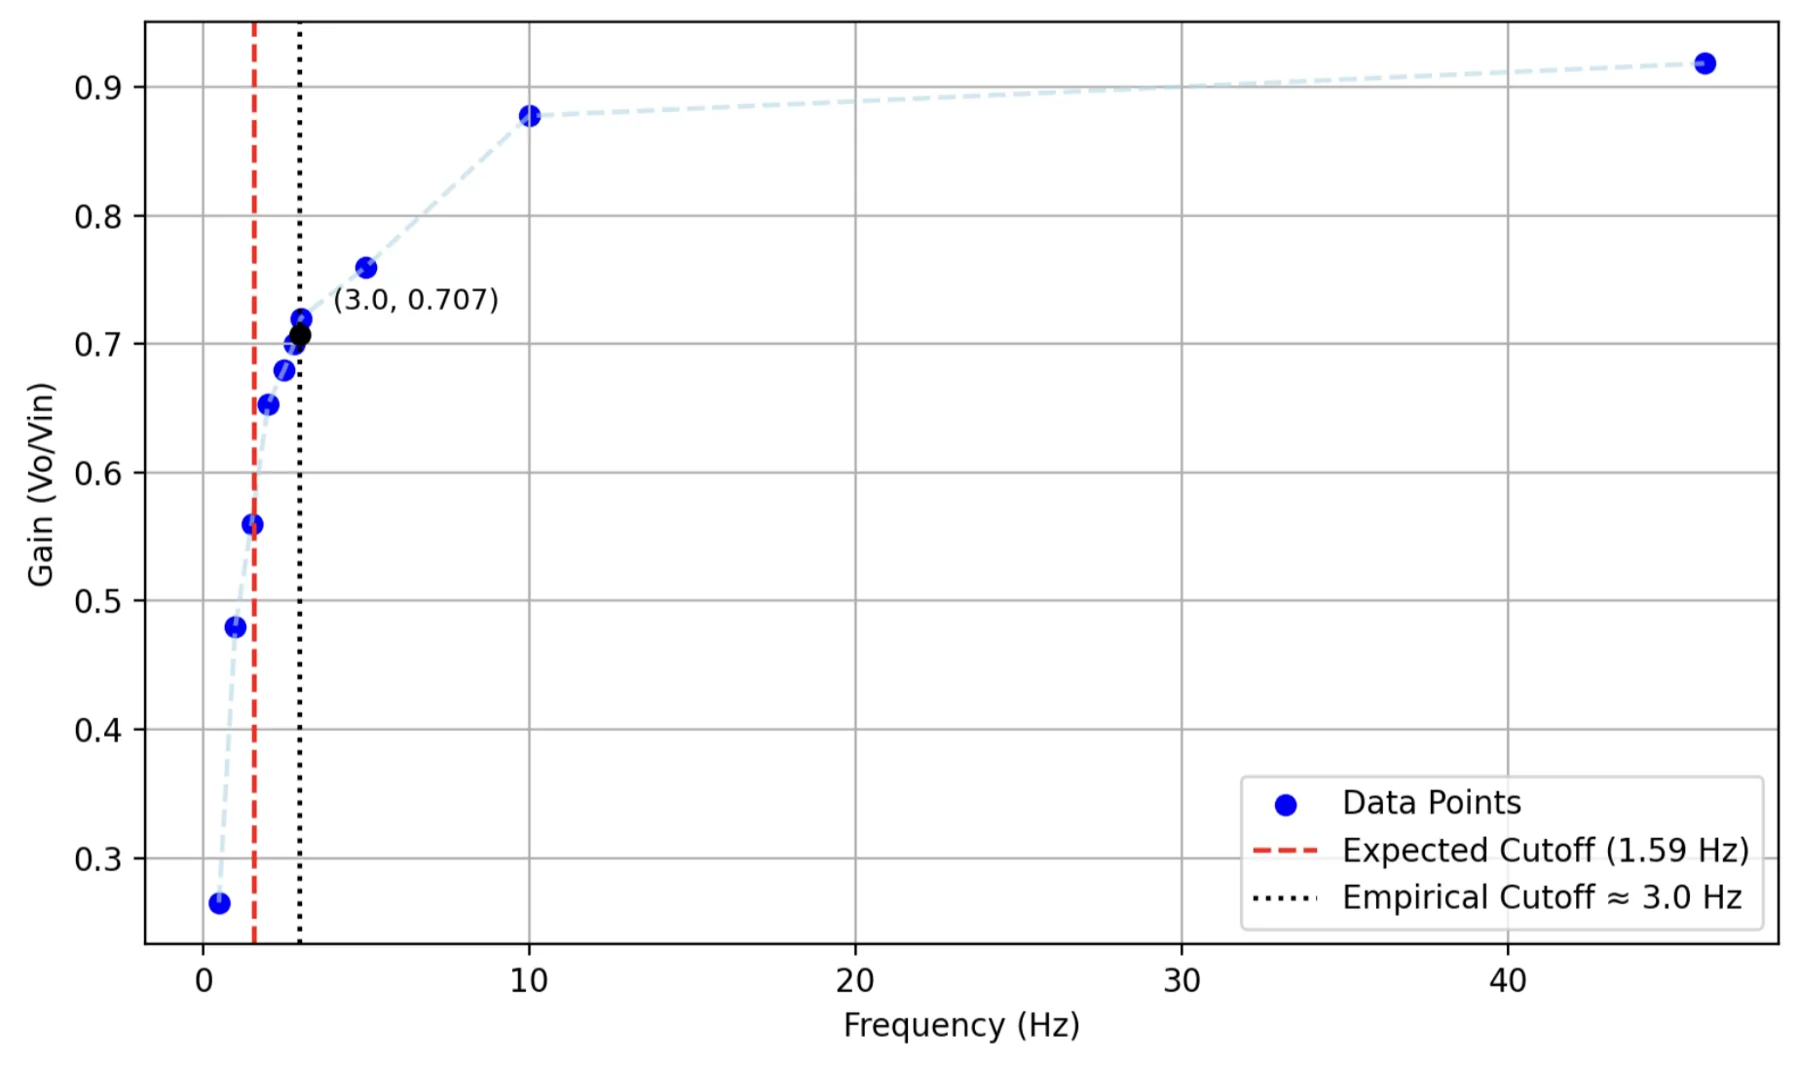
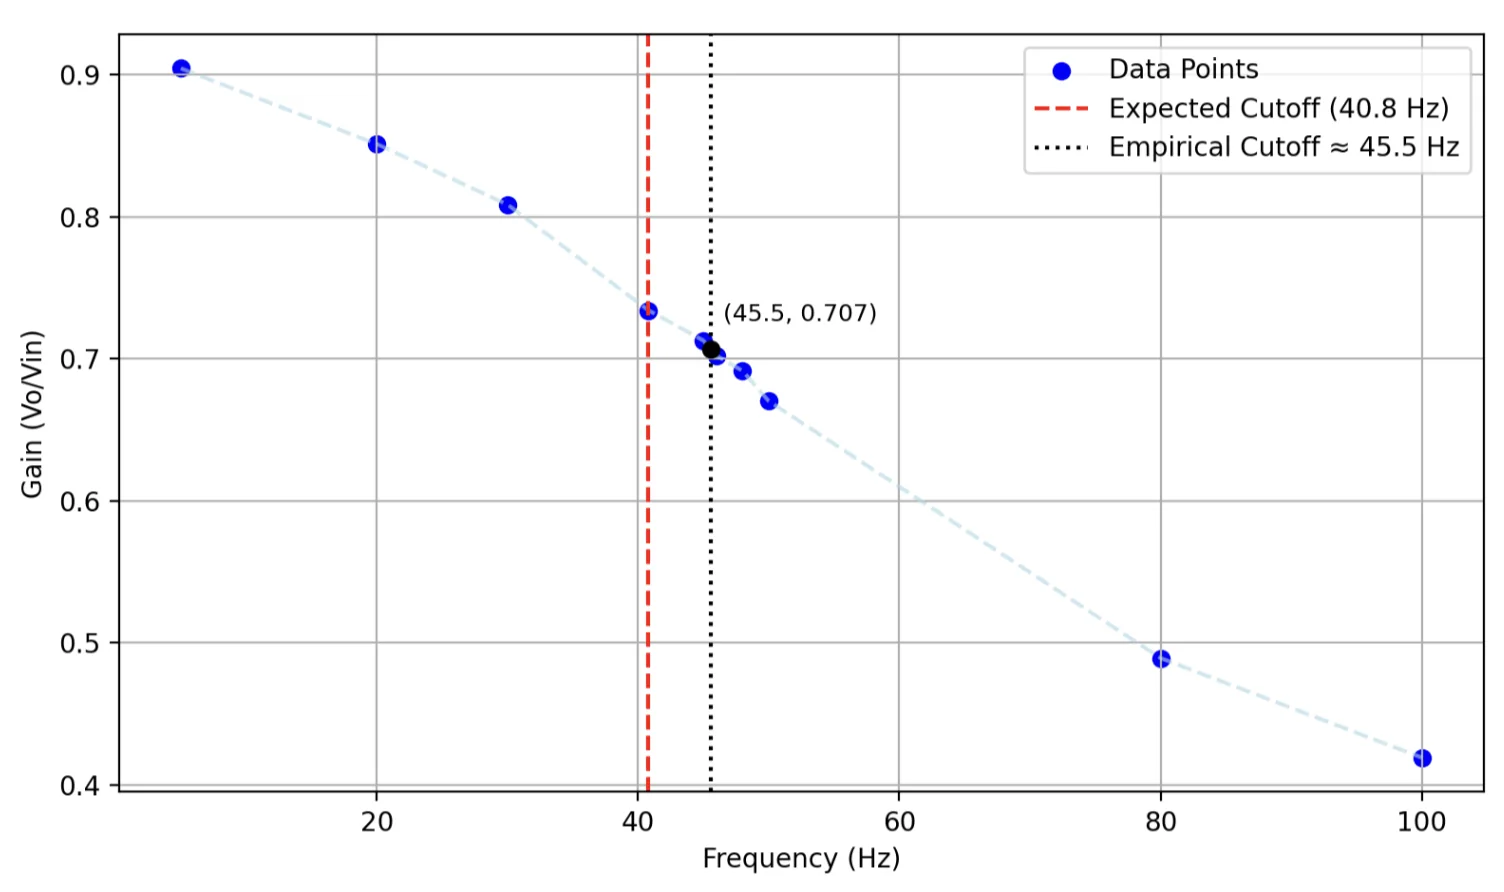
| Block | Target | Measured |
|---|---|---|
| Instrumentation amp gain | 1 | 1.001 |
| High-pass cutoff | 1.59 Hz | ~3.0 Hz |
| Low-pass cutoff | 40.8 Hz | ~45.5 Hz |
| Gain stage | 471 | 458 (avg, 4.6% off) |
The measured passband (3.0–45.5 Hz) still kept P, QRS, and T waves clearly distinct, and the comparator's pulses lined up with every R-wave.
Pacing Logic
- With the simulated and desired heart rates matched (80 and 120 bpm), it correctly withheld pacing, and calculated heart rate matched within 0.2%.
- One beat per minute slower than the target (79 vs. 80 bpm, 119 vs. 120 bpm), it paced on every beat, as it should.
- With 10% beat-to-beat variability added at 60 bpm, it paced only on the late beats and always timed from the most recent event, including an R-wave that landed during a stimulus.
Stimulation Pulse width measured 69 ms against a 70 ms target (1.4% off) at every rate. Intensity stayed above the rheobase threshold at frog-physiological rates (30 bpm) and was acceptable up to 50 bpm. At 120 bpm, intensity fell below threshold, which sets the circuit's current upper operating limit.
Bluetooth Telemetry
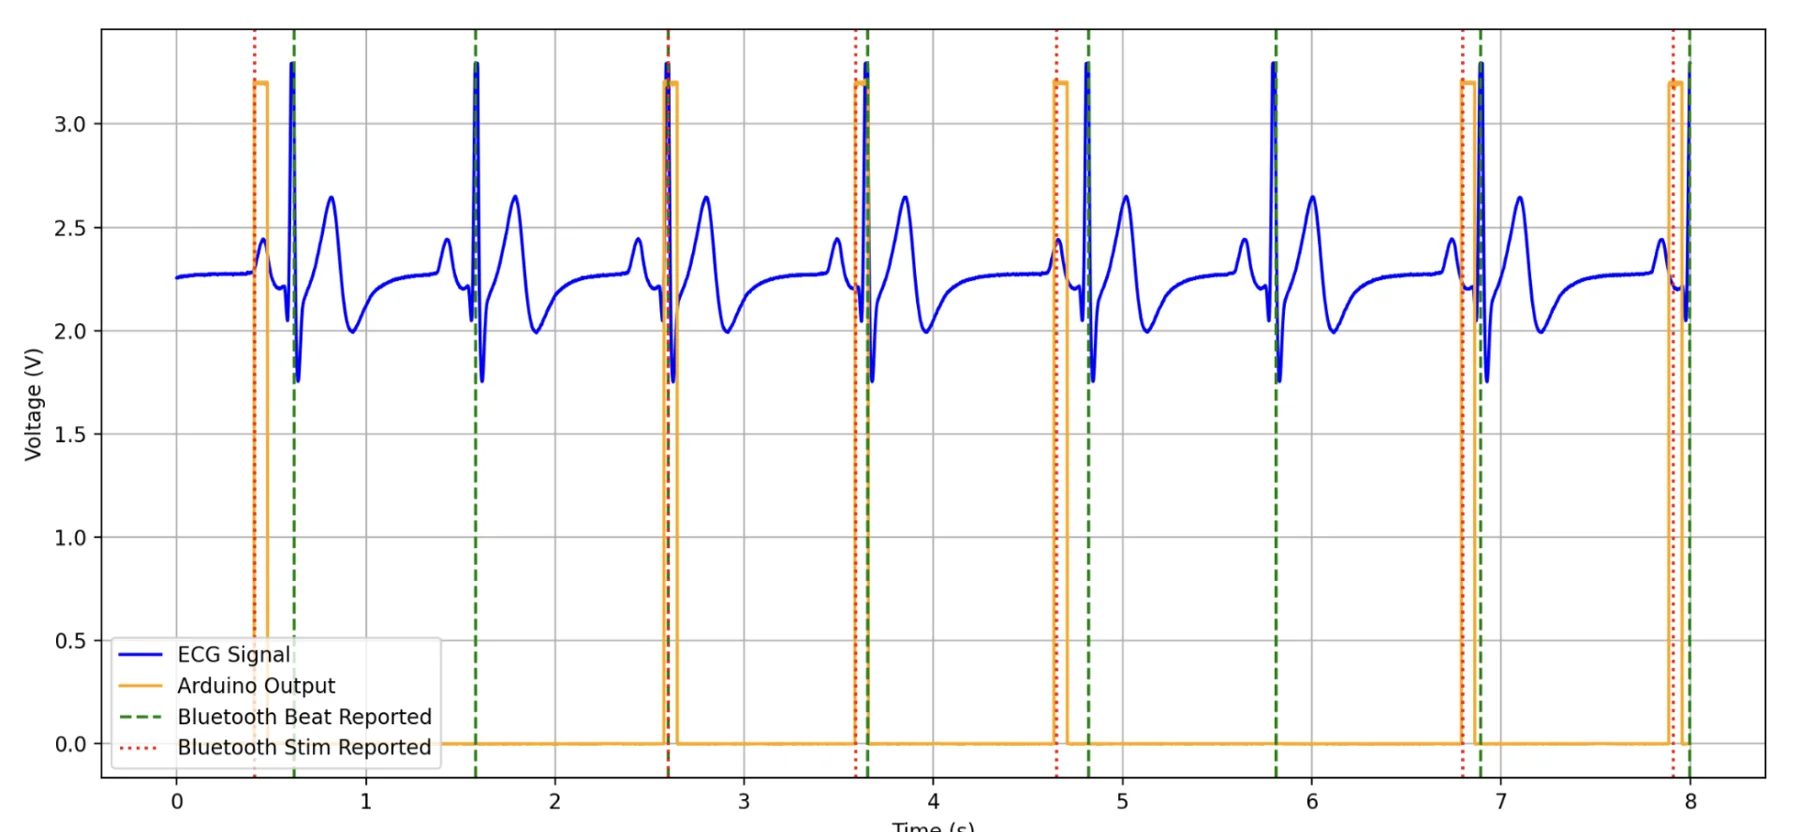
Every event arrived in the right order. Comparing onboard and phone timestamps, reporting latency averaged about 13 ms (max 24 ms) over the eight-second sample.
What I'd Do Next
Validate the complete Bluetooth-enabled system on live cardiac tissue, not just the earlier prototype, resize the stimulation stage so intensity holds up at higher rates, and build a proper app for patients and clinicians in place of a raw BLE terminal.
Next project
Blur Product Development · DFM enclosure and test automation