At a Glance
- What: A population-vector decoder, the foundational approach behind brain-computer interfaces (BCIs), built from raw spike times recorded in primate motor cortex during an 8-direction reaching task, following Georgopoulos et al. (1986).
- Data: Spike times from 30 motor cortex neurons across 160 reach trials, provided by the course.
- My work: All analysis and code in Python (NumPy, Matplotlib, scikit-learn): raster plots, firing-rate estimation, cosine tuning fits, and the population decoder.
From Spikes to Tuning
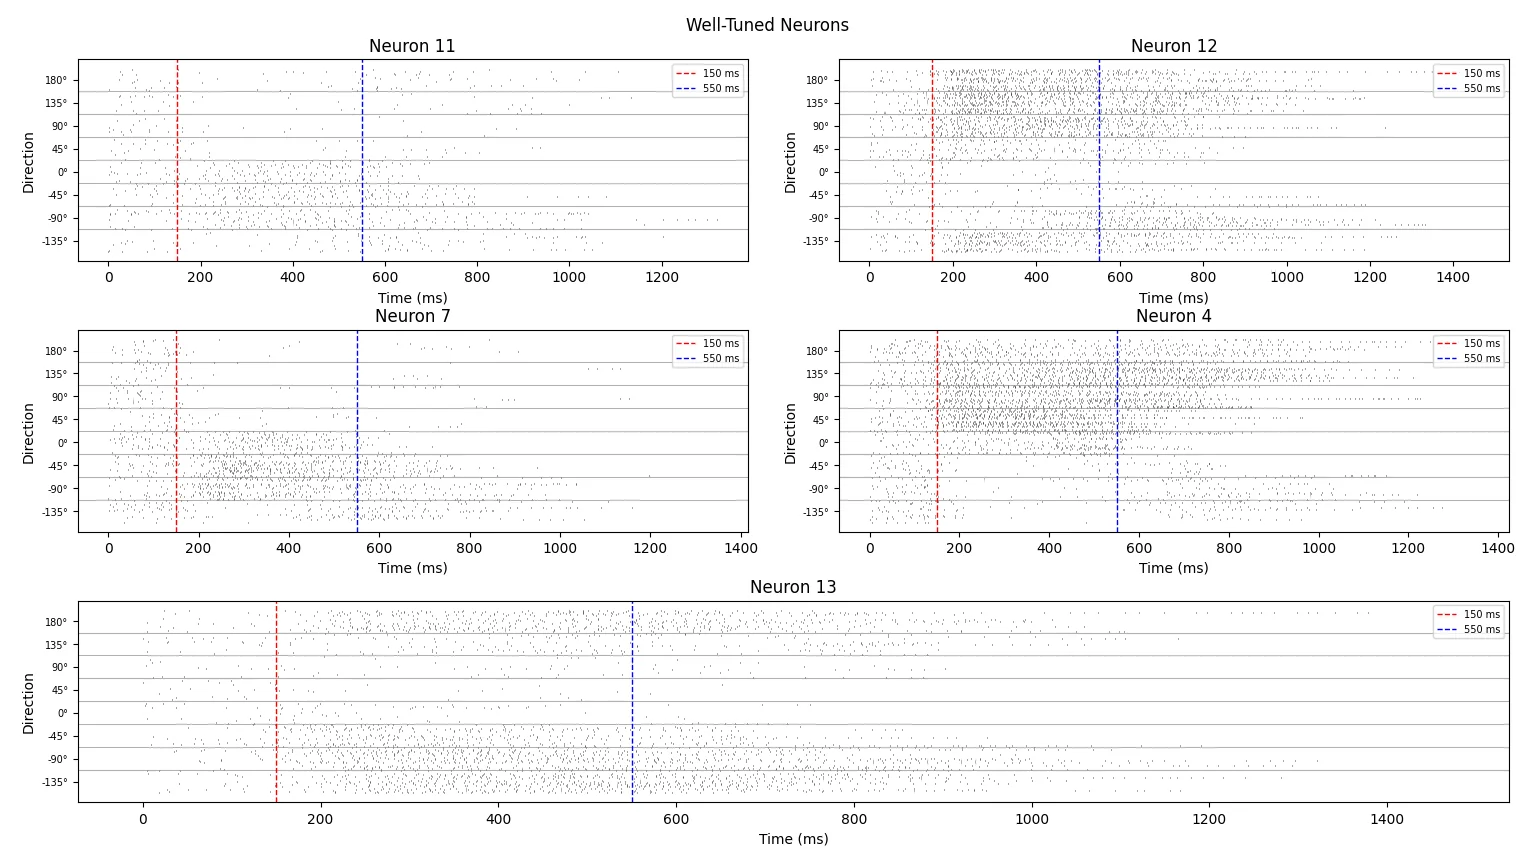
I started by plotting spike rasters for every neuron, sorted by reach direction, to separate neurons that clearly prefer a direction from ones that fire the same way regardless. To turn spikes into a firing rate, I binned spike times into 10 ms windows over the trial and averaged across trials for each direction. I then used the 150–550 ms window, after the visual reaction delay and during peak modulation, as each trial's firing rate.
Cosine Tuning
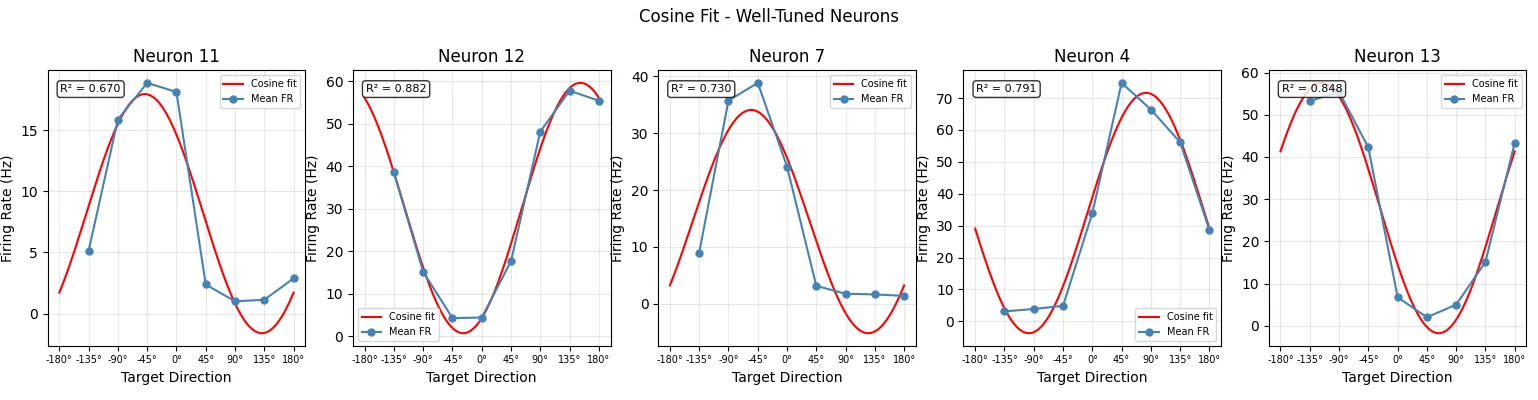
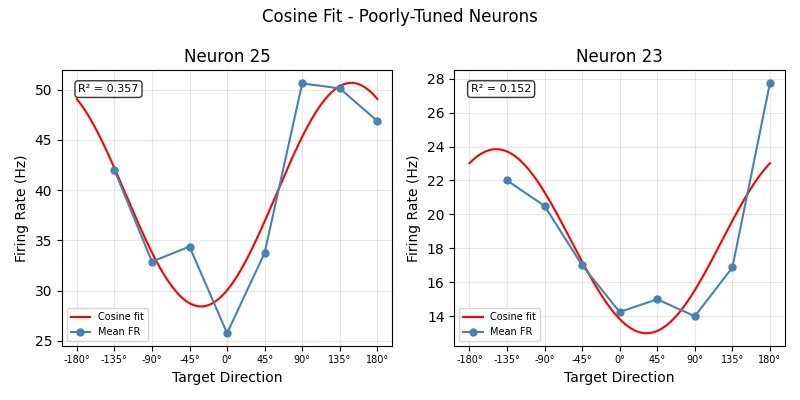
Motor cortex neurons fire most for one preferred direction and fall off roughly as a cosine away from it. I fit each neuron with a linear regression, FR = B₀ + Bₓ·Tₓ + B_y·T_y, which gives three properties per neuron: baseline firing rate (B₀), modulation depth (the magnitude of ⟨Bₓ, B_y⟩), and preferred direction (its angle). Well-tuned neurons fit with R² between 0.67 and 0.88, while the two poorly tuned neurons fit at 0.36 and 0.15.
Population Vector Decoding
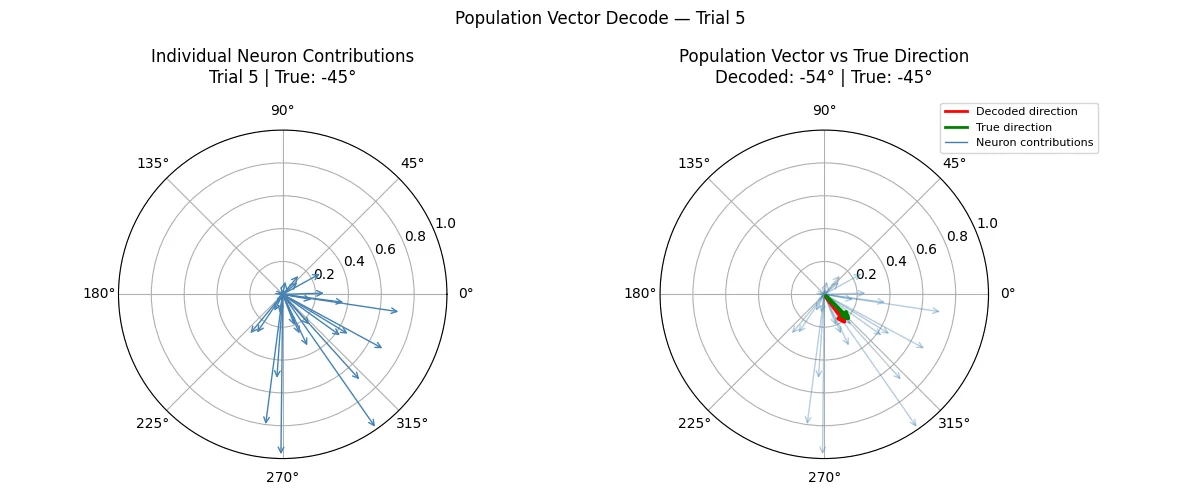
Each neuron's contribution is its preferred-direction vector scaled by its normalized firing rate, (FR − B₀) / modulation depth. Summing all 30 contributions gives the population vector, the direction the motor cortex is "pushing" the arm. On the example trial, the decoder pointed to −54° for a true reach of −45°, a 9° error from 30 neurons.
Where This Decoder Falls Short
- Real tuning isn't a perfect cosine. The regression forces a symmetric cosine, but real neurons often have skewed or irregular tuning.
- One number per trial throws away time. Averaging 150–550 ms into a single rate loses peaks outside that window and any direction-dependent timing.
- Every neuron gets an equal vote. After normalization, a poorly tuned neuron counts as much as a well-tuned one. A better decoder would weight neurons by how well they fit.
Next project
Hyperbaric Chamber IV Bag · Nitrogen containment for a hospital hyperbaric unit